The limit stress values used for gear rating are often obtained based on simplified testing methods that do not accurately represent the phenomenological mechanical behavior of worm wheels during running. It is therefore more advisable to perform experimental characterization of failure modes in actual gear running conditions. This article presents testing methodologies for fatigue, thermal, wear and ultimate torque characterization of plastic worm wheels.
Introduction
As noted in the previous article, the limit stress values \(\tau_{\mathrm{Flim}}\) and \(\sigma_{\mathrm{HP}}\) used for gear rating are actually obtained based on simplified testing methods like tensile fatigue data with a normalizing factor for \(\tau_{\text{Flim}}\) and rolling contact fatigue data used for cylindrical gears for \(\sigma_{\text{HP}}\). While these methods offer an approximation for defining limiting fatigue fracture and contact stress in worm wheels, they do not accurately represent the phenomenological mechanical behavior of worm wheels during running. It is therefore more advisable to perform experimental characterization of these failure modes in actual gear running conditions. This type of methodology is presented in more detail in the subsequent sections.
1 Testing Methodologies and Test Rig Setups
There are several available methodologies for the characterization of worm wheel materials in terms of the failure mode of interest. The limiting fatigue strength of the material as a function of load and stress can, e.g., be obtained by performing pulsator or tensile fatigue tests on a rig setup as presented in Fig. 1. The fatigue strength is characterized as a function of load and sample temperature, which is a highly important parameter also determining the material’s service life. These tests are usually performed in a positive sinusoidal cyclic fatigue load regime defined by the fatigue factor \(\mathrm{R} > 0\) (Fig. 2). While these tests offer a fast and fairly reliable method of fatigue characterization, they can oversimplify the actual stress state occurring during gear running, which is a rather complex function of the gearing geometry, meshing kinematics, contact ratio and load magnitude. Hence, it is advisable to perform tests on a suitable gear test rig, similar to the setup schematically presented in Fig. 3. This type of setup is applicable to both cylindrical and crossed-helical gearings and provides the most realistic load conditions in comparison with actual gear applications.
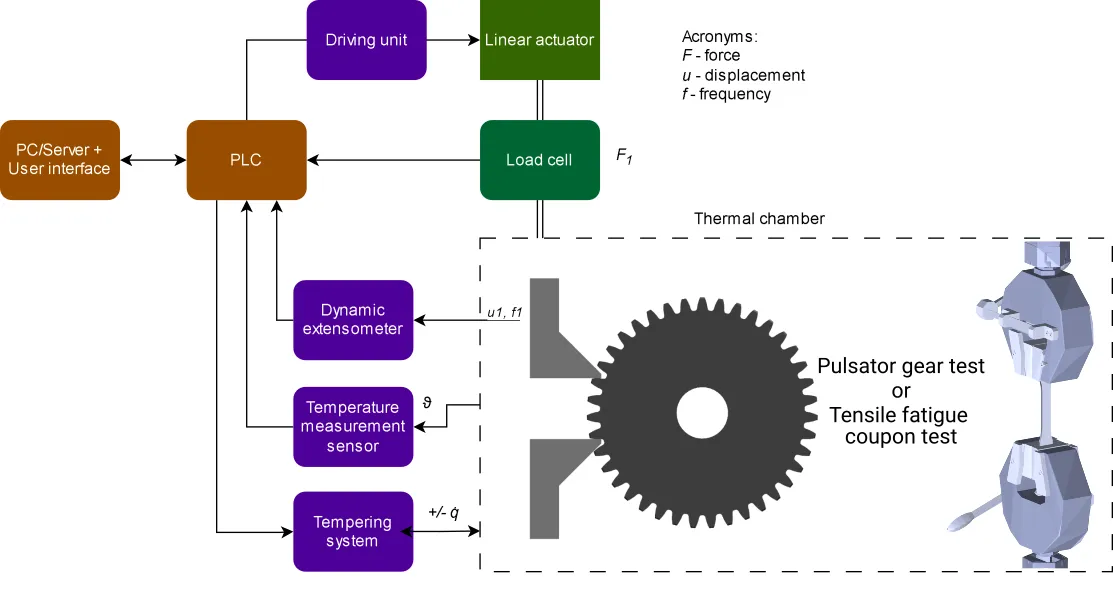
Fig. 1: Pulsator and tensile fatigue test setup used for limit fatigue stress characterization of polymer materials used for worm wheels.
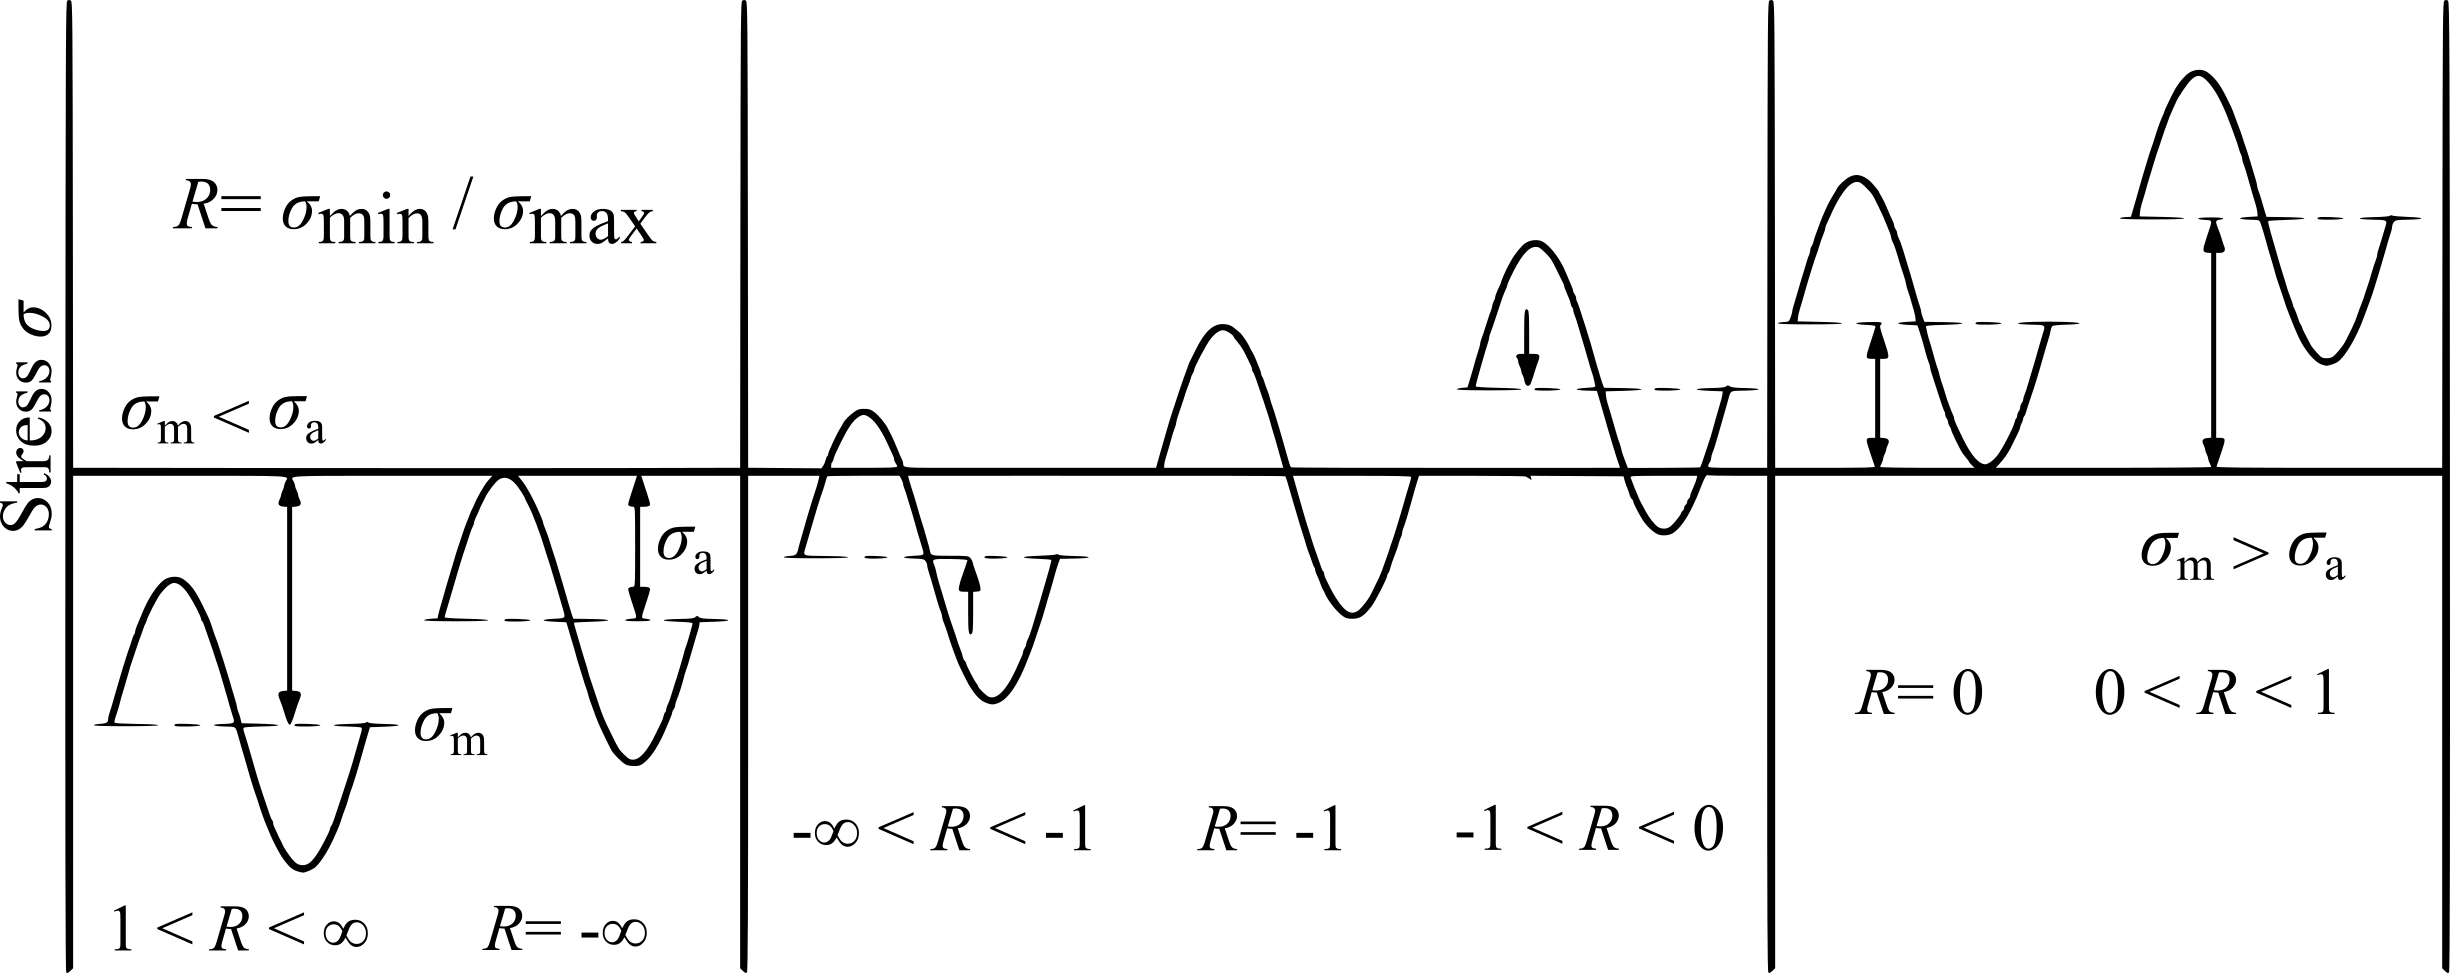
Fig. 2: Fatigue testing R-factor determining the applied cyclic load regime.
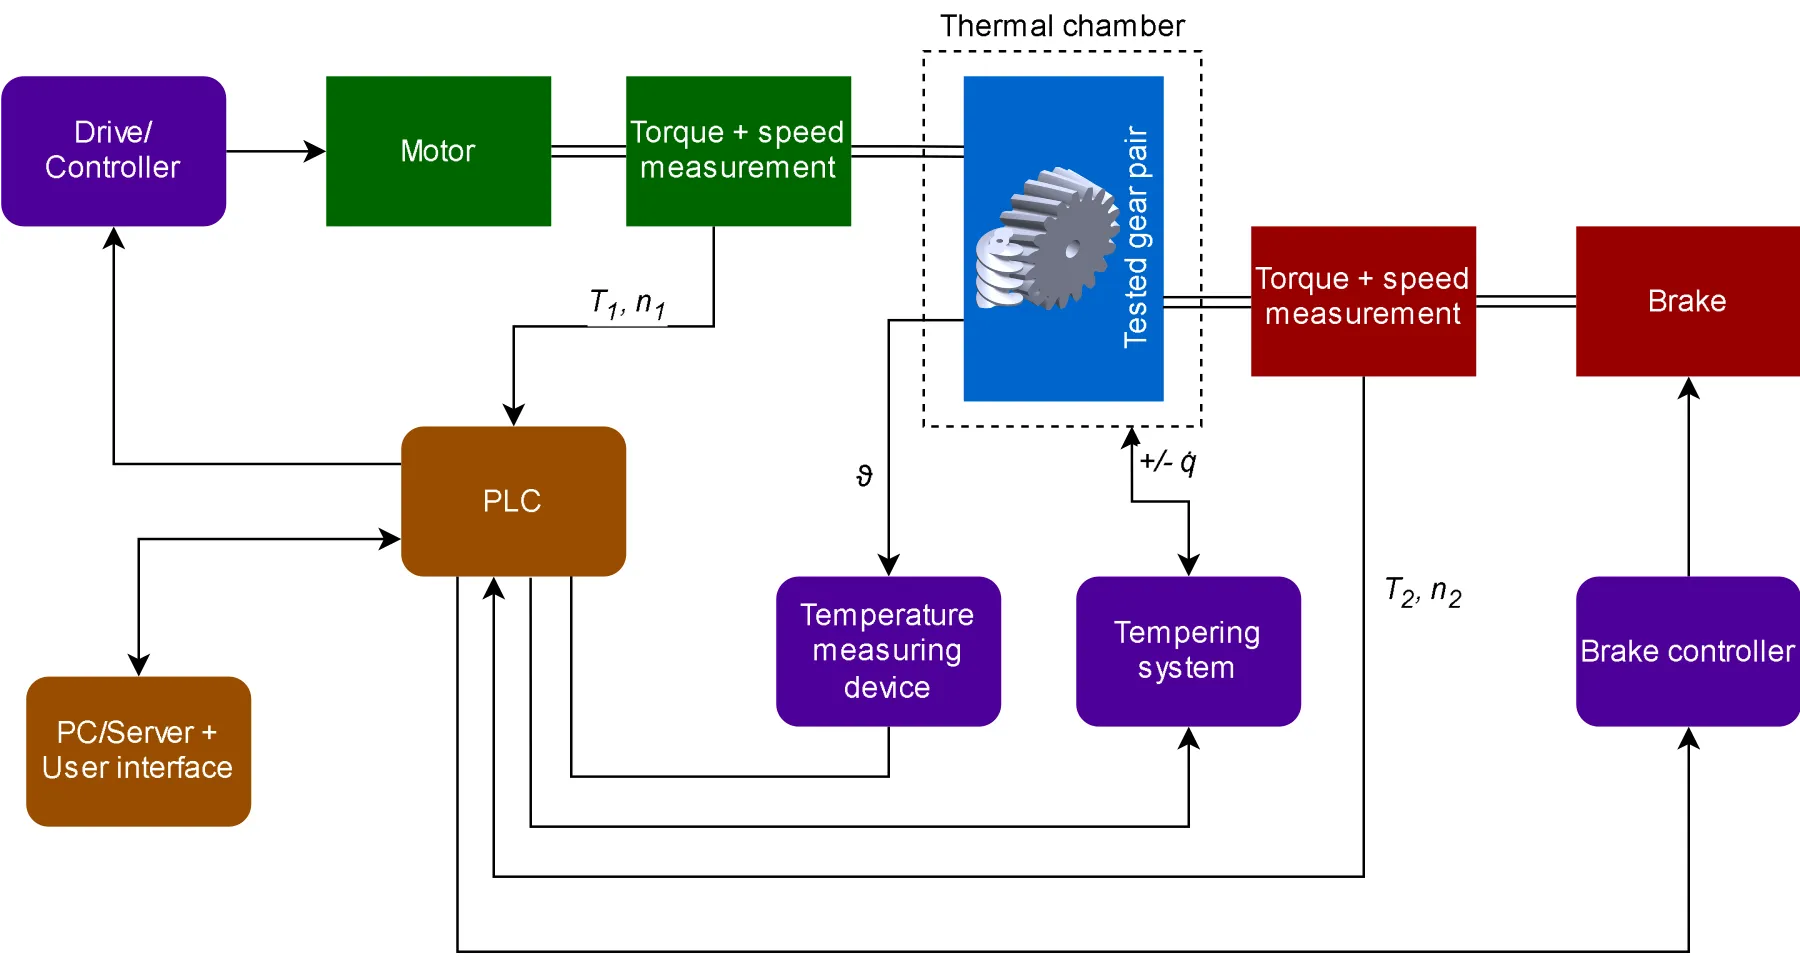
Fig. 3: Schematic of a general test rig setup suitable for worm gear pair experimental characterization testing.
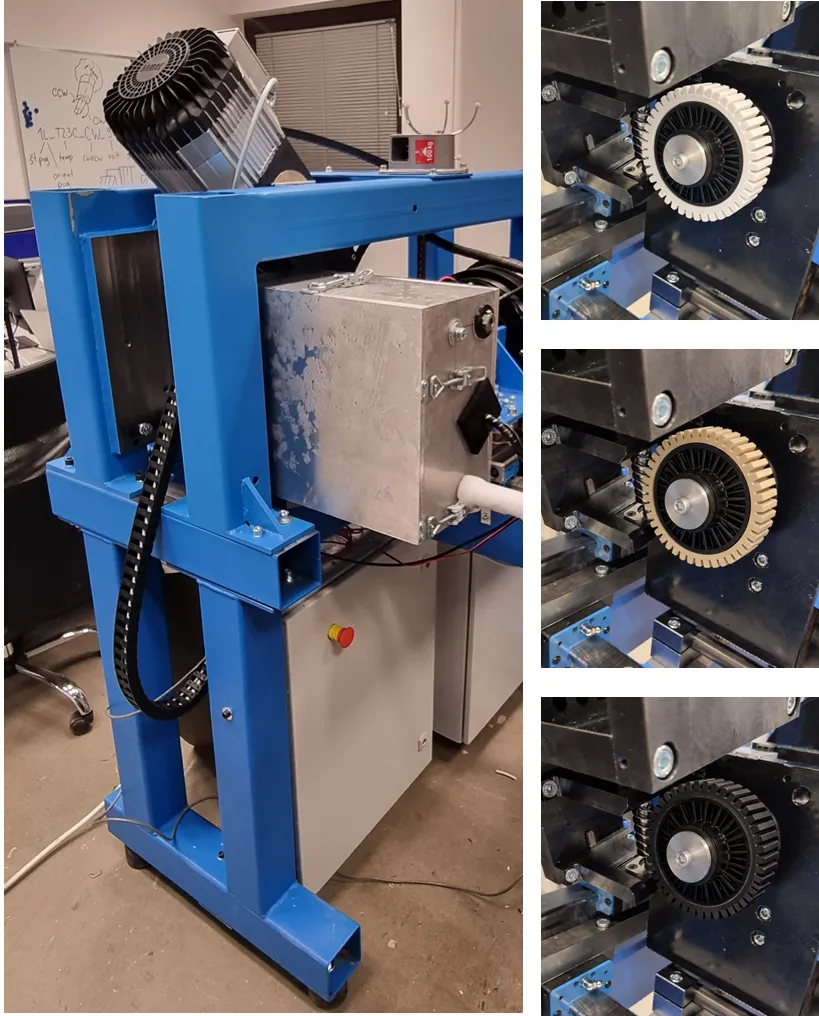
Fig. 4: General-purpose worm gear test rig (GTR-170 model by RD Motion). The test rig is suitable for performing lifetime gear tests, and failure mode-dependent limiting material strength characterization.
2 Testing Procedures
2.1 Thermal Measurements
Gears heat up during operation. Friction between the meshing teeth and hysteretic effects are the main reasons for the temperature increase in plastic gears. The rate of the heat generation and the resulting temperature rise depend on several factors, e.g. torque, rotational speed, coefficient of friction, lubrication, thermal conductivity, convection, gear geometry, etc. Frictional heating is especially pronounced for worm and crossed-helical gear pairs due to a large part of sliding motion in the contact. If the temperature of the plastic wheel exceeds the material’s limit temperature for continuous load transmission, a thermally induced failure as shown in Fig. 5 occurs.
Thermal measurements, paired with efficiency testing, prove to be very useful also for initial lubricant evaluation and comparison. A simple initial test to compare different greases is to run several tests at the same load conditions, apply different greases and track the temperature rise. Usually the grease with a less steep temperature rise (lower heat generation) is more convenient (see Fig. 6).
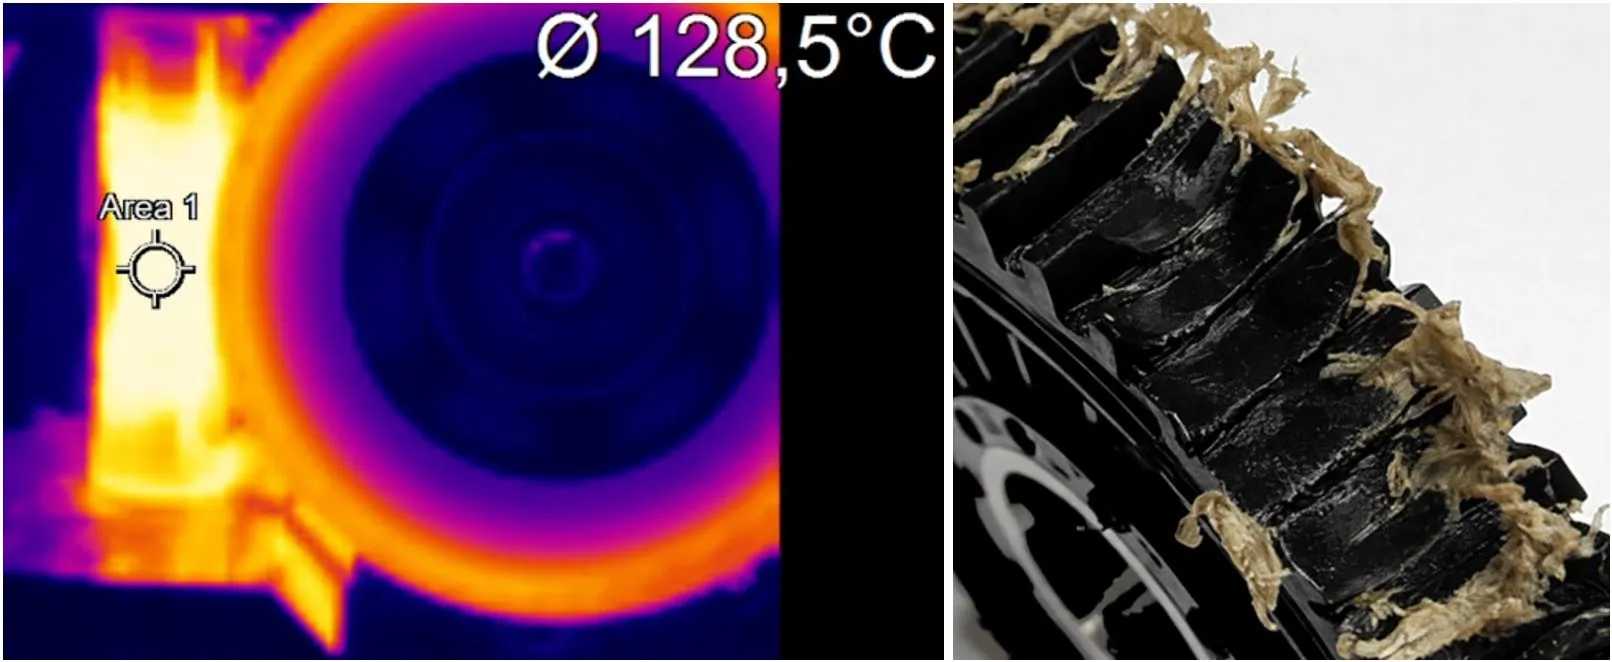
Fig. 5: Thermal failure on the worm wheel run in dry, non-lubricated conditions.
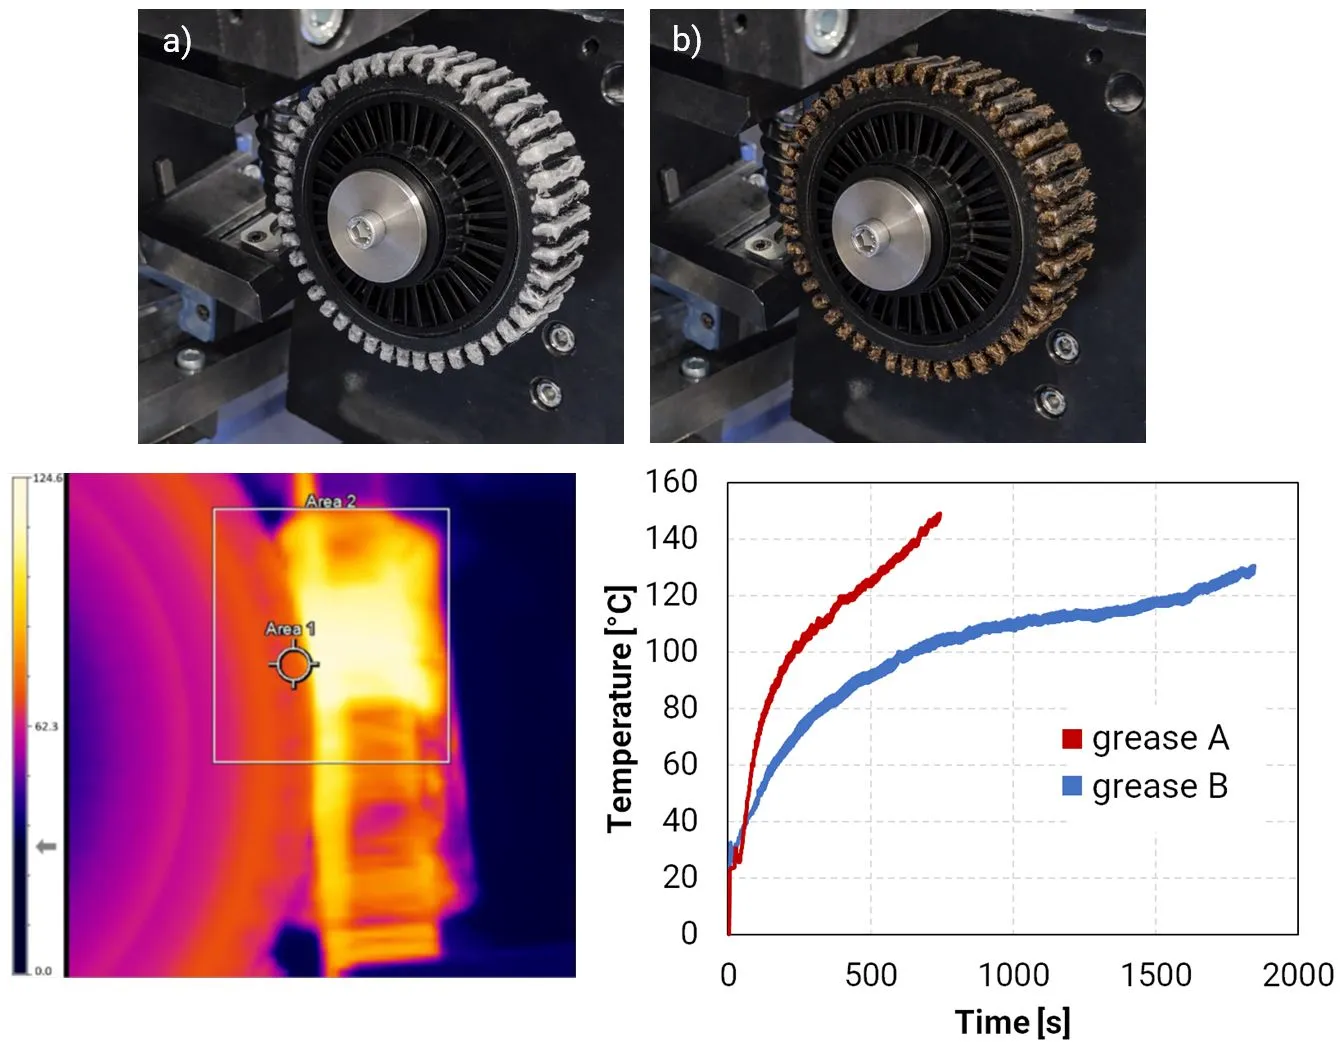
Fig. 6: Evaluating grease performance through thermal measurement.
2.2 Fatigue Characterization
In a gear-on-gear test methodology usually a combination of a steel worm and a plastic wheel is employed. The steel/plastic combination is most appropriate for the S-N curve testing since the curve is a property of a single material. Therefore the failure should occur on the wheel which is made of the material under evaluation. A plastic/plastic combination is also possible, however adequate failure detection mechanisms need to be applied to both gears then in order to stop the test at the first failure indication. Another detail to consider when testing a plastic/plastic gear combination is a significantly increased contact ratio, resulting in the actual stress in the material being lower than the one calculated by the analytical equations provided by relevant standards and guidelines. FEA proves to provide the most accurate result in such case.
In line with the VDI 2736: Part 4 [1] it is advised that the tests are executed on at least four different torque levels, where the torque is accurately controlled during testing (Fig. 7a). Without a proper test set-up, testing at four different torque levels, would result in four different plastic wheel temperatures (Fig. 7b). By definition the S-N curve represents the stress in the material versus how many load cycles of that same stress can material withstand before fracture occurs. Since the mechanical properties (strength, hardness, elastic modulus) of polymers and polymer composites are strongly temperature dependent, each S-N curve needs to be generated for one selected constant temperature level. Adequate sample-tempering system is therefore required in order to be able to control the plastic wheel’s temperature stable at the selected level, while wheels are being tested at four different torque levels (Fig. 7c). As in reality applications usually operate at different temperatures, several S-N curves, characteristic for different temperatures, are required for comprehensive gear design rating procedures (Fig. 7d).
All tests should be run until a fatigue-induced failure occurs. For an adequate failure analysis the test needs to be stopped at the indication of first fracture (Fig. 8), before the wheel is completely damaged making failure analysis not possible. It is advised to conduct at least three test repetitions at each tested torque level in order to ensure repeatability.
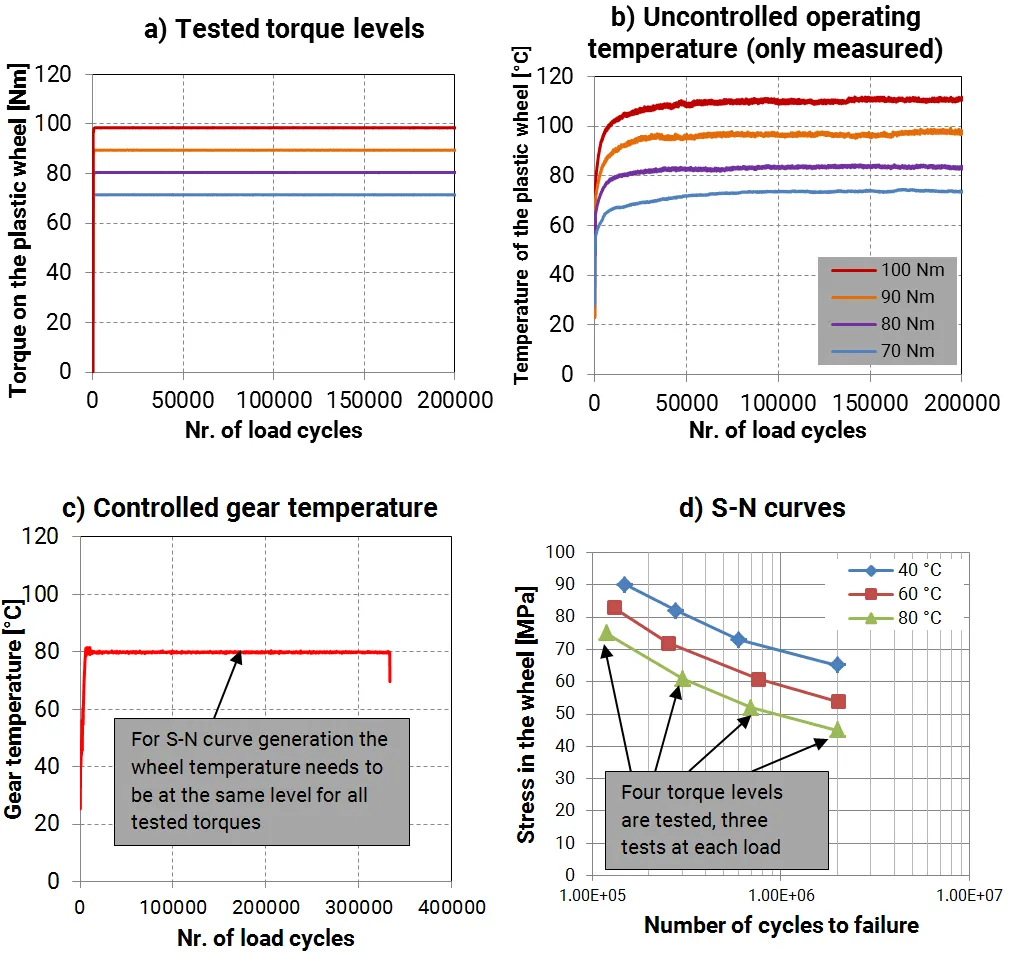
Fig. 7: S-N curve generation methodology.
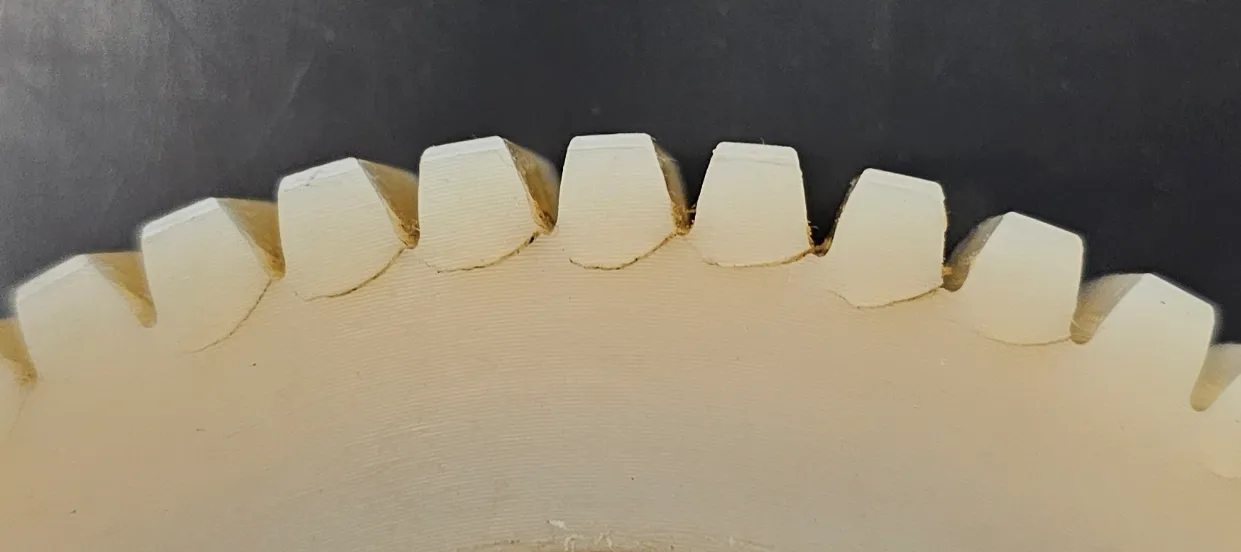
Fig. 8: Fatigue crack nucleation location as commonly exhibited during the performed tests.
2.3 Wear Characterization
While wear rate prediction models are not presented in the VDI 2736: Part 3 [2] guideline for worm gears (even though such model is defined for cylindrical gears in VDI 2736: Part 2 [3]), wear can notwithstanding be an important damage mode that can itself lead to failure or contribute to other failure modes like tooth fracture. In general, two categories of wear characterization methods can be utilized, i.e., the gravimetric (weight-loss) method shown in Fig. 9a or geometric (tooth thickness reduction) type of method shown in Fig. 9b. The downside of the gravimetric method is that the material can absorb moisture from the surroundings or the lubricant, which is affecting the result. Samples therefore need to be carefully treated and moisture intake adequately analyzed if this methodology is applied.
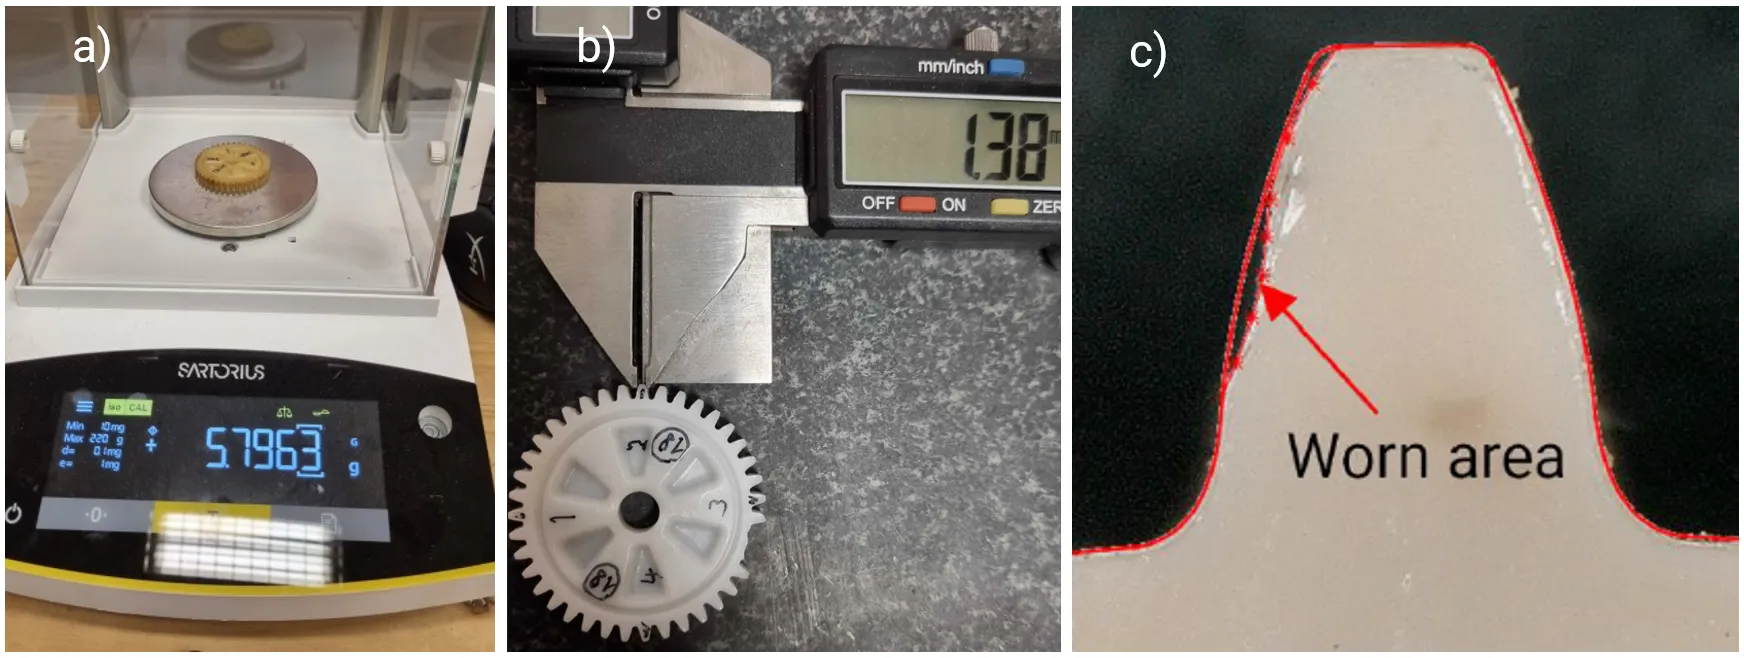
Fig. 9: Geometric tooth thickness reduction (a) and gravimetric (b) wear measurement methods.
The tooth thickness reduction method is not that sensitive to moisture intake, nevertheless it poses several challenges, mostly in terms of reducing measurement uncertainty which can result from:
- Location of measurement variation in the lead direction
- Angular deviations of the measurement tool relative to the tooth
- Variations in the diameter or height of measurement (in general measurements should be done at the reference circle diameter)
- Other operator-related errors
The noted sources of error can influence the measurements noticeably. It is therefore important to ensure repeatable measurement conditions and avoid any other external influencing factors and reduce the measurement uncertainty to the highest degree possible. To achieve consistent results, the measurements should be executed on an appropriate bench with positioning tables, while the measurement tool should be suitably calibrated and with high enough resolution to allow for micron level accuracy. Fig. 10 shows an example of wear progression curves, which are employed for wear rating purposes. In a same manner as with S-N curves, for plastics, also wear behavior is temperature dependent and needs to be characterized for several temperature levels.
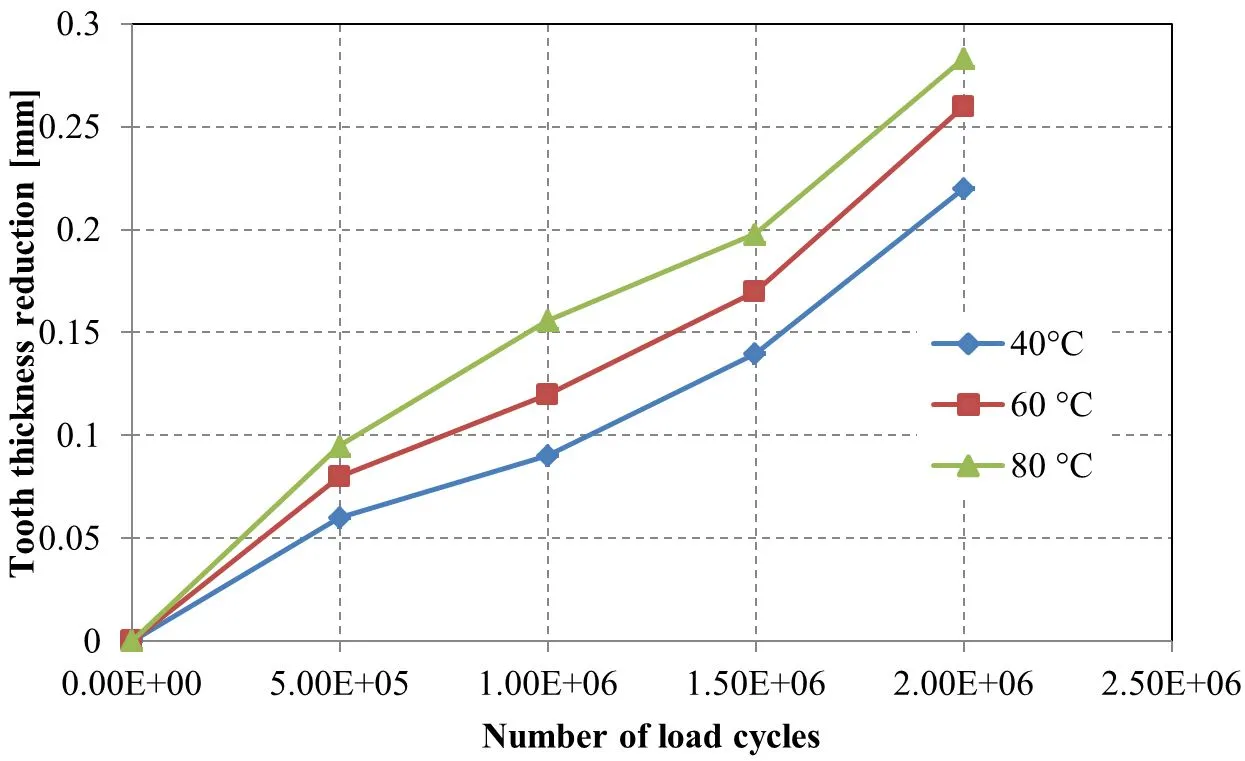
Fig. 10: Wear progression in terms of tooth thickness reduction.
2.4 Ultimate Torque Testing
Crossed-helical and worm gear drives are in many applications (e.g. electric powered steering) subject to short-lived but extremely high loads. For such load cases the typical cycle-to-failure numbers are below \(N_{L} = 10^{3}\) (sometimes this number can be in the \(10^{1}\) range). In such cases the ultimate (or peak) torque \(T_{\mathrm{sp}}\) and correlated ultimate local stress need to be evaluated. To this end, purpose-built test rigs, as the one shown in Fig. 11, can be employed. The test rig provides the required torque overload via the worm, while the worm wheel is fully fixed. In this setup, the failure is achieved in one sweep of the worm tooth in contact with the tested tooth on the fixed wheel. The device therefore enables direct measurement of the ultimate torque that can be applied to the gear pair.
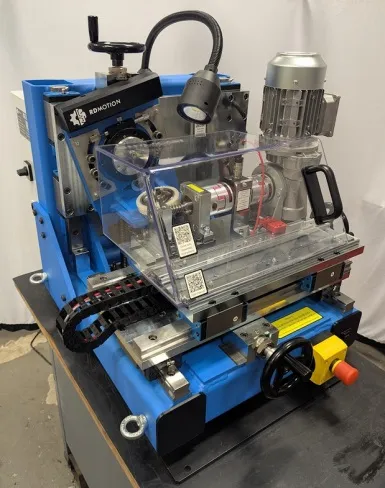
Fig. 11: Ultimate-torque test rig (STR model by RD Motion).
References
- VDI 2736: Blatt 4, Thermoplastische Zahnräder, Ermittlung von Tragfähigkeitskennwerten an Zahnrädern, 2014.
- VDI 2736: Blatt 3, Thermoplastische Zahnräder, Schraubradgetriebe Paarung, Zylinderschnecke, Schrägstirnrad, Tragfähigkeitsberechnung, 2014.
- VDI 2736: Blatt 2, Thermoplastische Zahnräder, Stirngetriebe, Tragfähigkeitsberechnung. VDI Richtlinien, 2014.