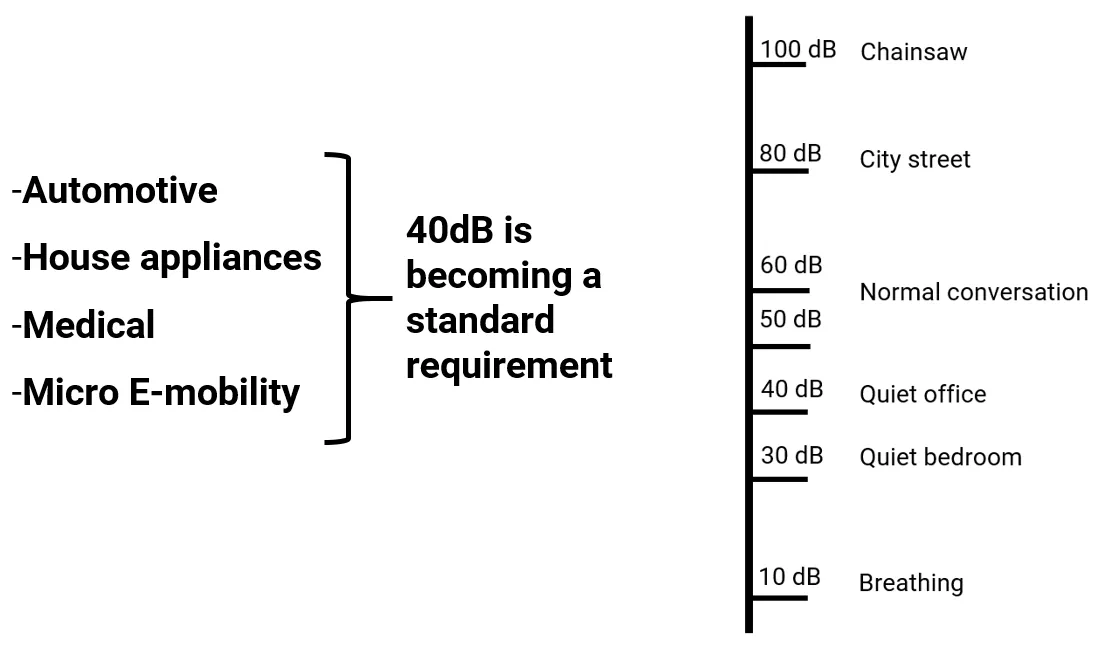
Continuously growing demands on user experience determines the gearbox NVH to be held at a minimum. The 40 dB mark is becoming a standard requirement in many sectors. Plastic gears show great potential to tackle the NVH challenges of modern gearboxes. Switching from steel gear pair to steel/plastic or plastic/plastic combination enables an easy and substantial reduction of noise and vibrations.
Introduction
Selecting the right material pairing can lead to great improvements. However, when considering plastics, even different material pairings show different NVH performance. Selecting the right one for the application of interest is the key that leads to best possible results.
This study presents an experimental methodology, employed to characterize the NVH behavior of plastic gears in application-like operating conditions, furthermore presenting guidelines for material selection in terms of optimal gear NVH. Five different combinations of plastic materials were utilized, both unreinforced and fiber-reinforced, however, it was always a dissimilar combination of the materials applied for the testing. The evaluated noise and vibrations are compared to a benchmark steel gear pair.
Test Samples
The test gear geometry was defined as per VDI 2736; Part 4. Plastic gears according the VDI 2736 "size 1-gear geometry" were produced and used for the tests. Gears were produced utilizing 6 commercially available plastic compounds, commonly employed for gear applications. The molding tool was designed with a possibility to exchange cavities, hence several different were employed for molding in order to compensate different shrinkage of the tested materials. The goal was to produce all gears in the same quality range in order to exclude the gear quality affecting the NVH performance.
To avoid excessive commercialism only the chemical formulation of the grades will be disclosed as following:
- Polyoxamethylene (homopolymer) - POM
- Polyamide 66 - PA66
- Polyamide 6 + 15% glass fibers – PA6+15%GF
- Polyphthalamide + 30% glass fibers – PPA+30%GF
- Polyamide 66 + 30% glass fibers – PA66+30%GF
- Polyoxymethylene + 10% aramid fibers – POM+10%AF
As a benchmark for comparison three sets of steel gears (heat treated 42CrMo4) were also produced.
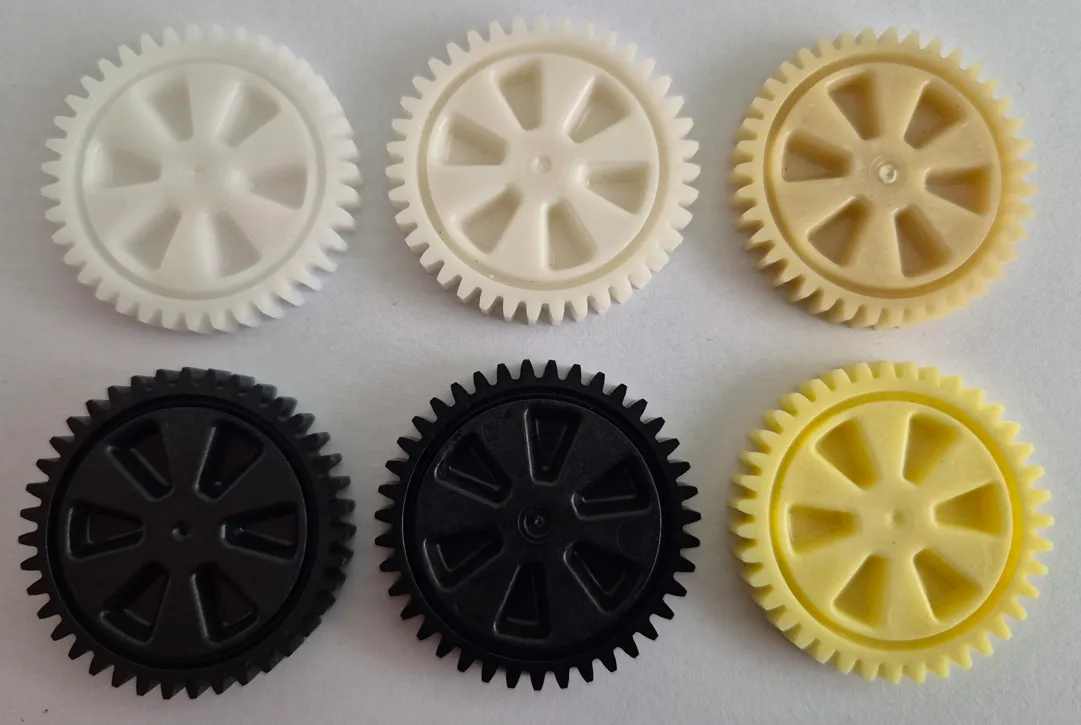
Fig. 1: Molded samples, employed for testing
Geometric Parameters of the Tested Gear Pairs
| Parameter |
Nomenclature |
Unit |
Value |
| Centre distance | a | mm | 38.45 |
| Normal module | mn | mm | 1 |
| Face width | b | mm | 6 |
| Number of teeth | z1/z2 | / | 39 |
| Tip diameter | da1max/da1min | mm | 40.40/40.30 |
| da2max/da2min | mm | 40.40/40.30 |
| Root diameter | df1max/df1min | mm | 35.866/35.691 |
| df2max/df2min | mm | 35.866/35.691 |
| Tip rounding | rK1 / rK2 | mm | 0.08 |
| Profile shift coefficient | x1 | / | -0.259 |
| x2 | / | -0.259 |
| Pressure angle | αn | ° | 20 |
| Helix angle | β | ° | 0 |
| Profile | h*aP | / | 0.96/0.96 |
| h*fP | / | 1.25/1.25 |
| ρ*fP | / | 0.25/0.25 |
Three gears made of each material were subject to geometric quality measurements on a Zeiss CMM machine, employing a Zeiss VAST XXT scanning sensor. The measured gear parameters were profile, lead, pitch and runout, which were characterized according ISO 1328 gear quality inspection standard. Based on the evaluated quality grades, which were for all the materials on a very comparable level, it can be concluded that the gear's quality factor did not have a notable effect on the gear pair's NVH response during testing.
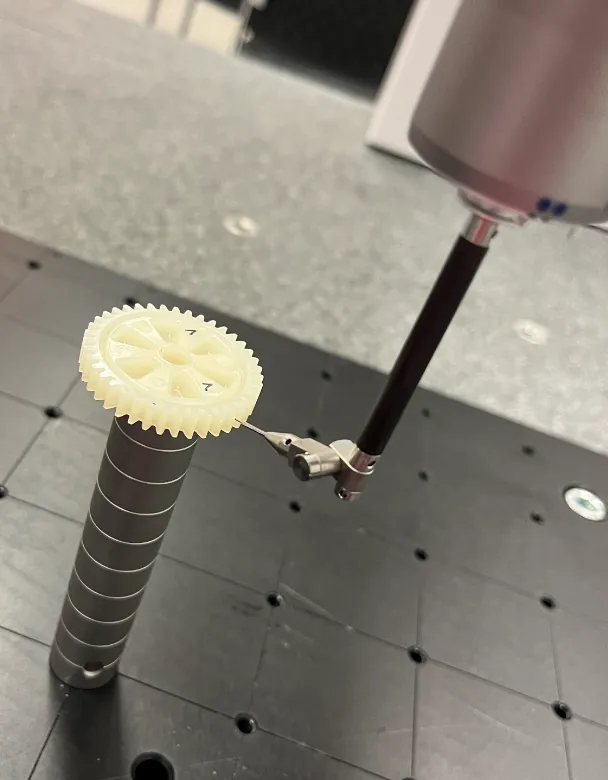
Fig. 2: Sample gear during the geometric quality inspection
Determined Quality Grades for Produced Sample Gears
| Parameter |
POM |
PA66 |
PA6+15%GF |
PPA+30%GF |
PA66+30%GF |
POM+10%AF |
Steel |
| Total profile deviation (Fα) | 9 | 10 | 10 | 10 | 10 | 10 | 8 |
| Profile form deviation (ffα) | 4 | 5 | 6 | 5 | 5 | 6 | 6 |
| Profile slope deviation (fHα) | 10 | 10 | 10 | 10 | 10 | 10 | 8 |
| Total lead deviation (Fβ) | 10 | 10 | 10 | 10 | 10 | 10 | 8 |
| Lead form deviation (ffβ) | 4 | 6 | 5 | 4 | 4 | 5 | 6 |
| Lead slope deviation (fHβ) | 10 | 10 | 11 | 11 | 11 | 11 | 7 |
| Single pitch deviation (fp) | 8 | 9 | 9 | 8 | 8 | 8 | 6 |
| Total pitch deviation (Fp) | 9 | 10 | 10 | 9 | 9 | 9 | 7 |
| Runout (Fr) | 10 | 9 | 10 | 9 | 10 | 10 | 7 |
Testing Conditions
The gear pairs were tested inside a closed acoustic chamber, mounted on the MTP series gear test bench, isolating the tested gear pair from the surroundings. That way only the noise generated by the tested gear pair could be measured, without an influence from other noise sources. Rotational speed, torque and gear temperature were precisely controlled during all tests. As the NVH performance depends on the operating conditions, the gears were tested at two torque levels, and for each torque level at three rotational speeds, evaluating the effect of both operating parameters. The gear temperature was controlled at 80 °C in all tested cases. The tests were run in dry conditions. For each material combination, three test repetitions were conducted to ensure repeatability. A new gear pair was employed for each test. The center distance at which the gears operated was precisely set by a precision positioning mechanism with an accuracy of 0.01 mm.
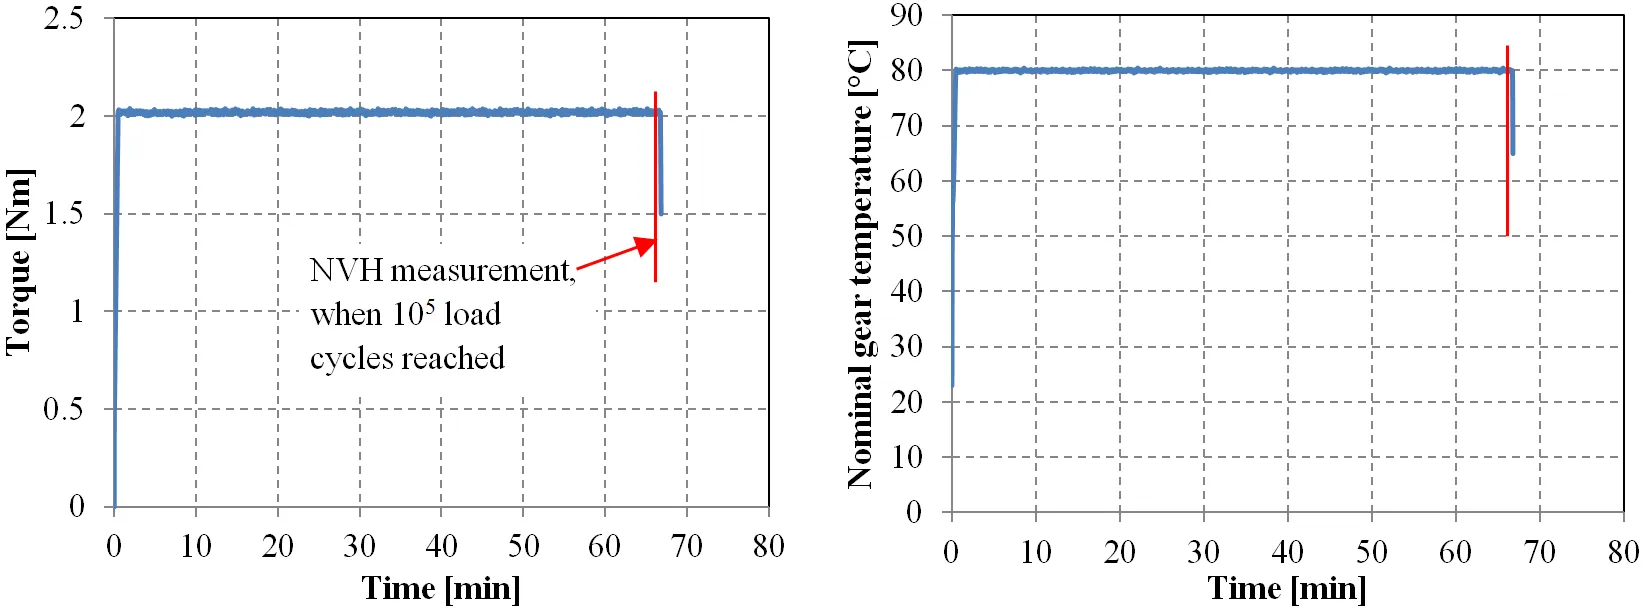
Fig. 3: Torque and gear temperature were precisely controlled during each test. NVH measurements were done when 105 load cycles were reached
Test Conditions
| Index |
Torque [Nm] |
Rotational speed [rpm] |
Nominal root stress [MPa] |
Gear temperature [°C] |
| L1 | 2.0 | 500 | 50.74 | 80 |
| L2 | 3.25 | 500 | 82.46 | 80 |
| L3 | 2.0 | 1500 | 50.74 | 80 |
| L4 | 3.25 | 1500 | 82.46 | 80 |
| L5 | 2.0 | 2500 | 50.74 | 80 |
| L6 | 3.25 | 2500 | 82.46 | 80 |
*All loads were tested in grease and in dry conditions. Three tests were executed for each selected test conditions and a new set of gears was used for each test.
Six different material combinations were tested, employing grades commonly used for gear applications. As a benchmark for comparison a steel gear pair of a same geometry was tested. Tested material combinations:
- Steel – Steel (reference) (536.30 MPa)
- POM – PPA+30%GF
- PA66 – PPA+30%GF
- POM – PA66
- PA6+15%GF – POM+10%AF
- POM – PA66+30%GF
An accelerometer was mounted on the bearing housing near the driven gear and a microphone was placed in front of the tested gear pair. The tests with plastic gears were run for 105 load cycles, where operation was considered to reach steady state conditions and the wear was not yet present and affecting the NVH performance. After the 105 load cycles were reached the noise and vibration signal were captured. The duration of each measurement window was 10 s, with a sampling frequency rate of 20 kHz.
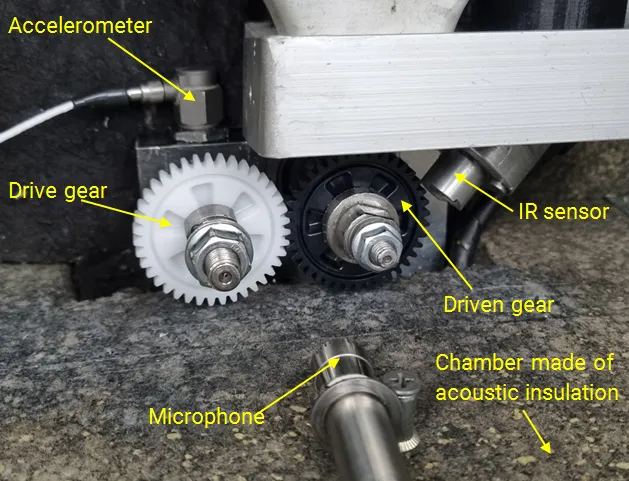
Fig. 4: NVH testing set-up
NVH Evaluation Metrics
Three metrics are usually evaluated for the acquired signals, i.e. the Peak value (Max. amplitude), the Peak-to-Peak and the RMS value. The Peak value and the Peak-to-Peak value represent only a single point value and do not take into account the total signal energy, that is, any fluctuation or transient vibration of higher value can influence this metric. The increase of Peak value or the Peak-to-peak may indicate the appearance of impacts in the signal, which can be isolated once-a-time events.
The RMS (root mean square) value is the effective value of the signal. It is calculated based on the entire sample using the following equation:
\[ x_{RMS} = \sqrt{\frac{1}{n} \cdot (x_1^2 + x_2^2 + \ldots + x_n^2)} \]
More practically, the RMS value is a measure of the vibratory energy of the system. Unlike the Peak and Peak-to-Peak values, the RMS value is not a point value, but rather a representation of the total signal energy.
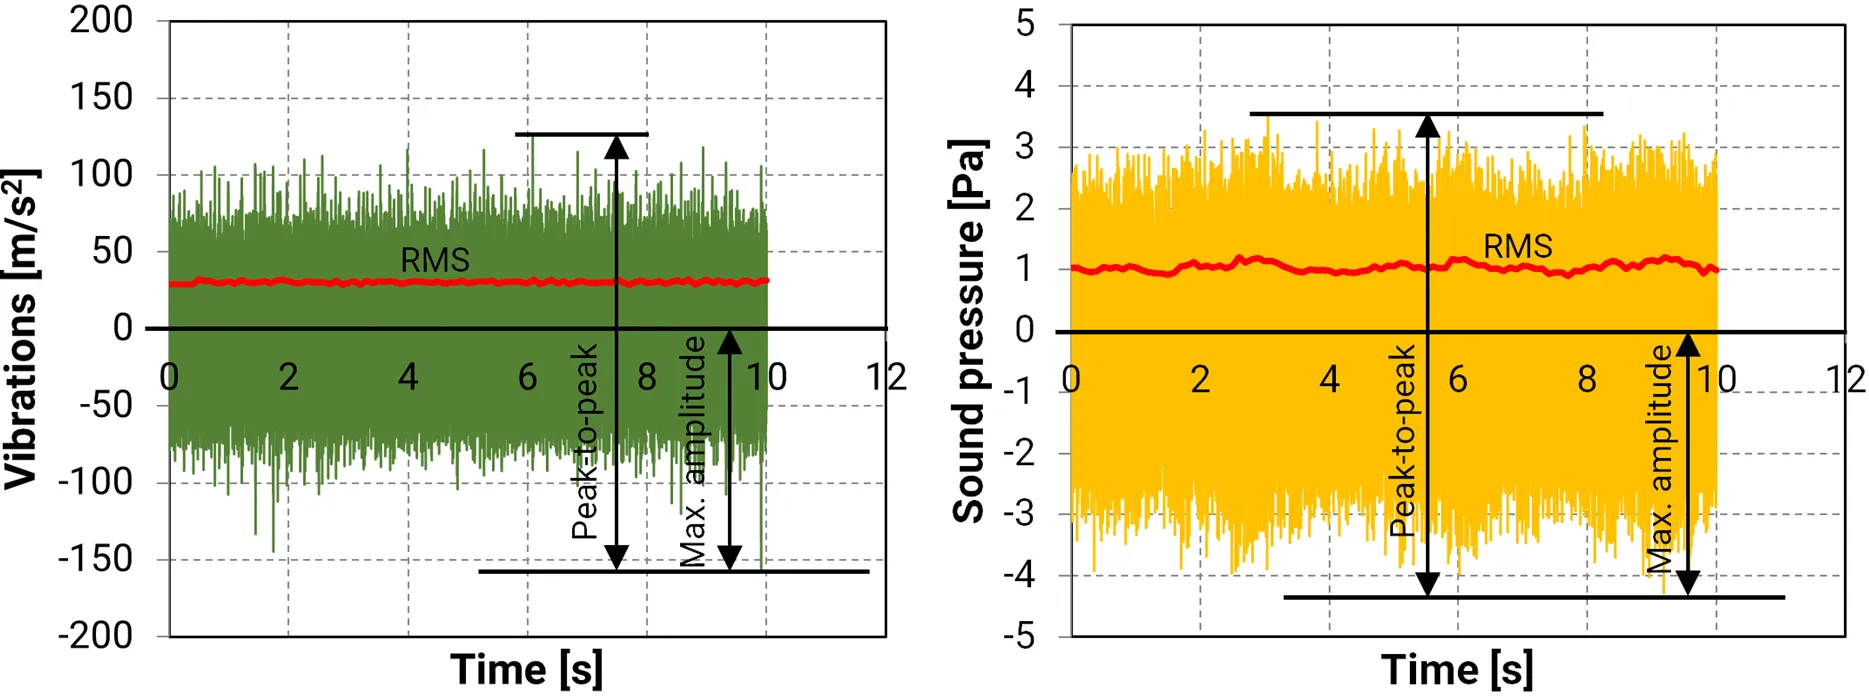
Fig. 5: Acquired vibrations and sound pressure signal
The measured sound pressure was converted to sound pressure level which is a logarithmic (decibel) measure of the sound pressure relative to the reference value of 20 μPa threshold of hearing. The threshold of hearing is the quietest sound that most young healthy people can hear. Following equation was employed for the conversion:
\[ L_p = 20 \cdot \log_{10}\left(\frac{p}{p_0}\right) \]
where \(p\) is the root mean square sound pressure and \(p_0\) is the reference sound pressure (20 μPa or 0.00002 Pa).
Results
The results show a relatively linear increase of measured sound pressure level for the benchmark steel gear pair while a much more complex behavior was found for the plastic gear pairs. The measured noise levels for the steel gear pairs were approx. 10 dB higher than the loudest tested plastic gear combination. Between the plastic gear pairs, and at the lowest tested rotation speed, a difference of 10 dB could be observed between the best performing and the worst performing combination. Increasing the rotational speed led to an increase in the measured sound pressure level. A rather small difference between the measured noise levels could be observed at the highest rotational speed. It should be noted that an average person can distinguish a sound pressure level difference of 3 dB, a difference bellow that can hardly be recognized, especially at noise levels above 100 dB.

Fig. 6: Sound pressure level, measured for the tested gear pairs. The temperature of plastic gears was controlled at 80 °C in all tests (temperature measured on the teeth).
It should be noted at this point that the gear pairs were tested in an isolated acoustic chamber and only the noise generated by the gear pair was measured. In an actual gearbox the most of the noise is usually generated by the housing, while the main cause for housing excitation are vibrations generated by the gears, which are transmitted to the housing through the bearings and shafts. The RMS values of the vibrations for the steel gear pairs were in some cases more than 100% higher, hence a much louder operation of gearboxes containing only steel gears can be expected.
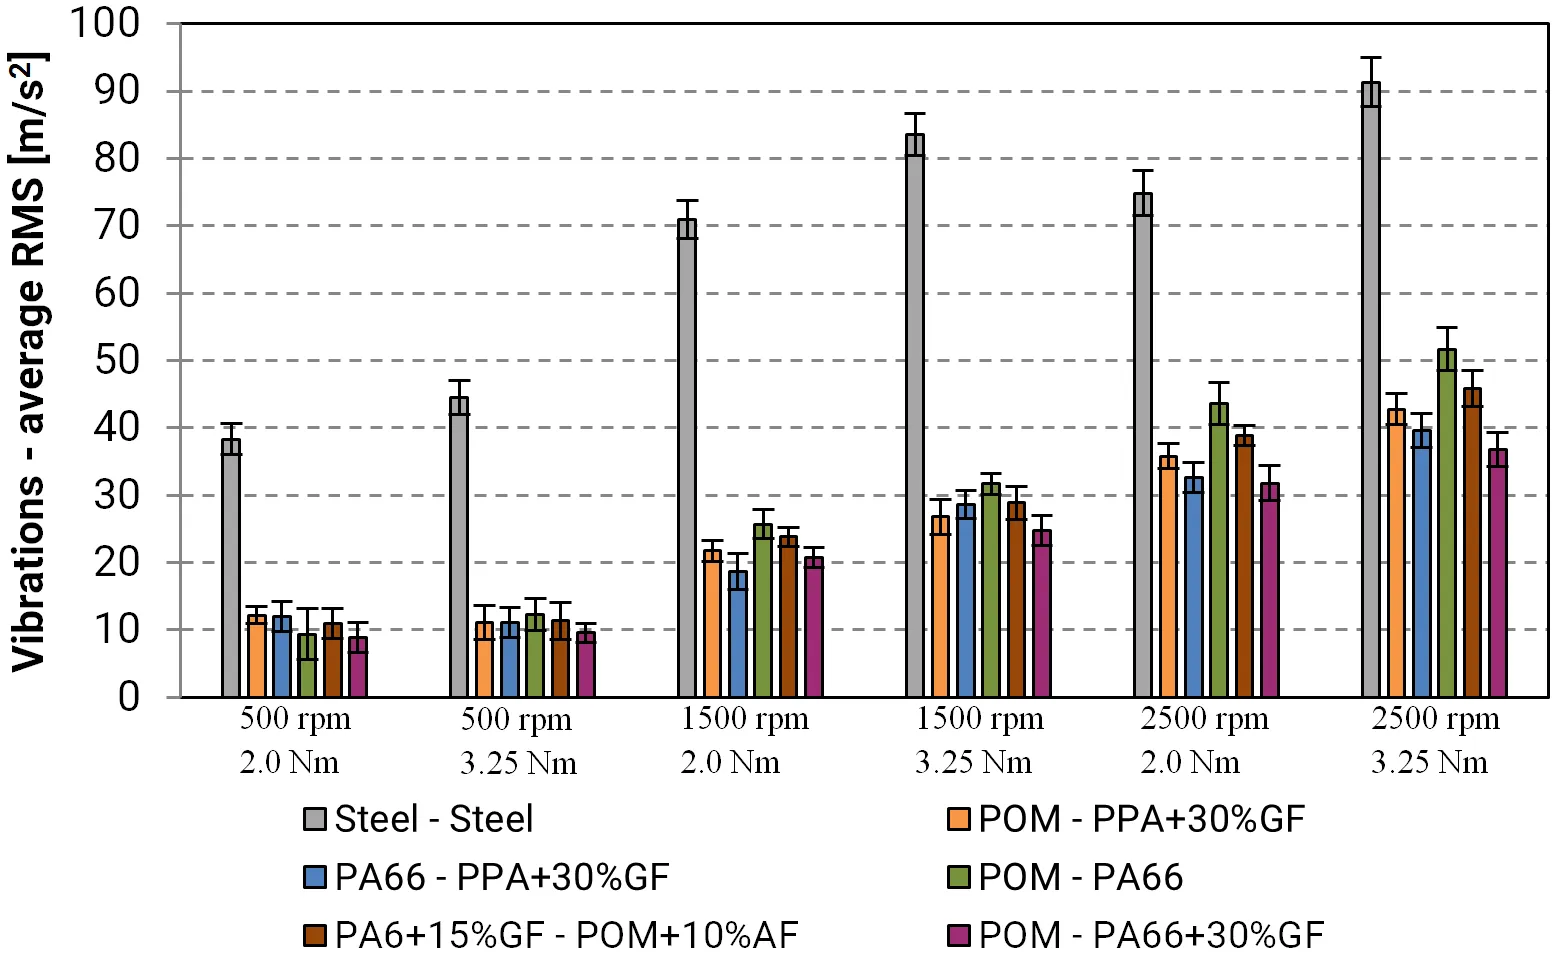
Fig. 7: Vibrations, measured for the tested gear pairs. The temperature of plastic gears was controlled at 80 °C in all tests (temperature measured on the teeth).
All material combinations were tested at the same load, i.e. same torque, rotational speed and controlled gear temperature. However, the modal characteristics of the tested gear pairs are not the same since the materials exhibit different density and stiffness. Hence also the gear's eigen frequencies are located at different positions in the frequency domain. That means that the steel/steel gear pair has totally different eigen frequency as the plastic/plastic gear pairs. Also, the eigen frequencies of plastic/plastic combinations (composed of different materials) are different in comparison to each other.
If a structure is excited at the eigen frequency, or near it, the amplitude of the response rises significantly (in theory is an exponential rise). Therefore one material pair can show higher vibrations at a certain rotational speed than the other, and then show lower vibrations than the comparing material pair at a different rotational speed (excitation level). Such phenomena will also occur in a real application, if the load is varying (which is the case many times).
Fast Fourier transforms (FFTs) of the measured vibration and sound pressure signals were generated in order to verify that the measured NVH was the result of gear meshing and not any other associated effects, e.g. motor noise, bearings, exterior noise. It was crucial that for all the analyzed signals the most pronounced peak in the frequency domain corresponded to the gear meshing frequency. By that it could be confirmed that the measured values were indeed the resulting NVH of the meshing gear pair.
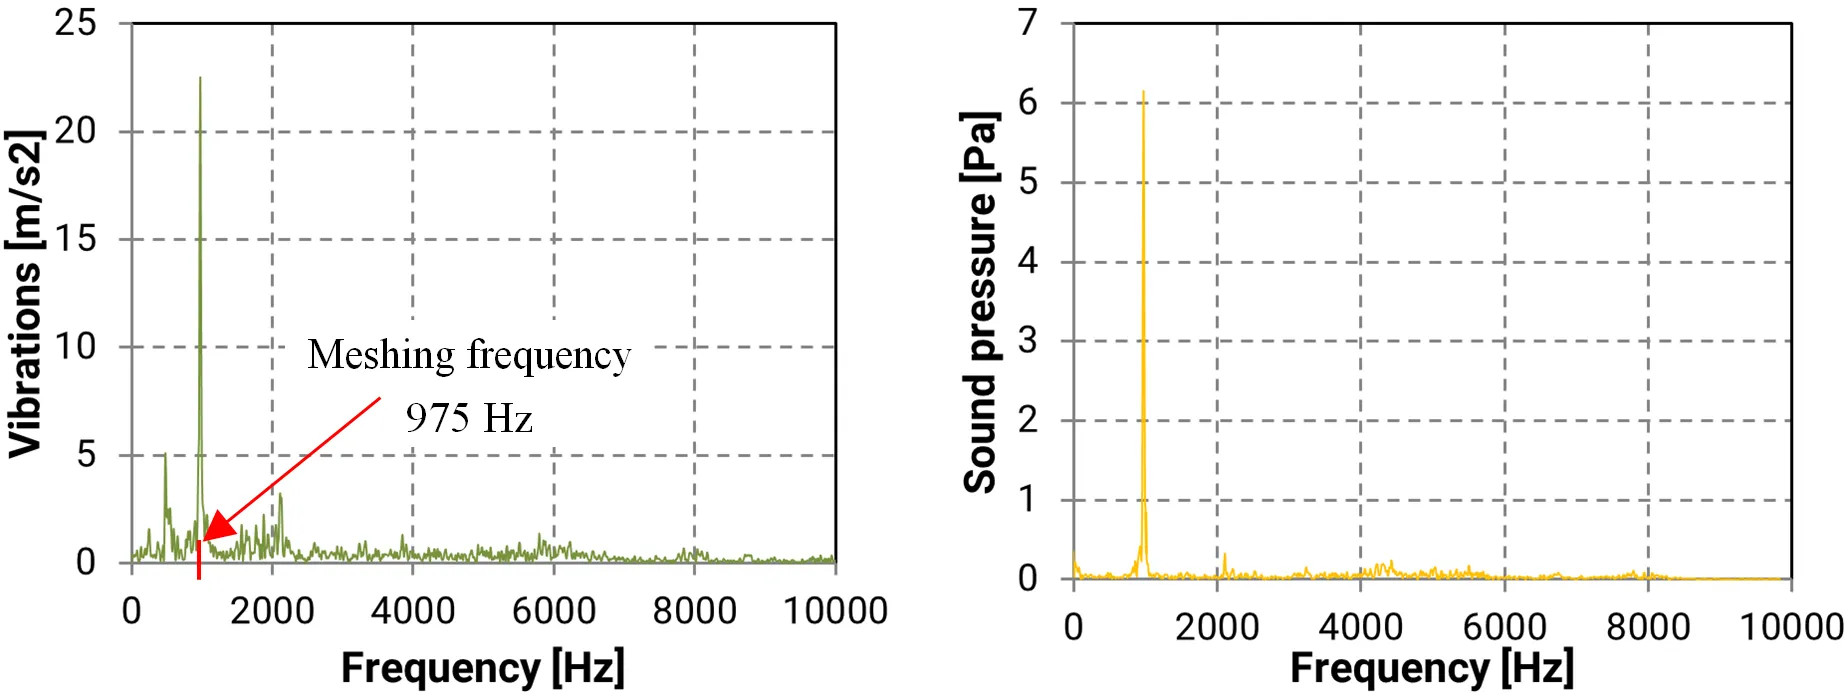
Fig. 8: FFT of the measured vibrations and sound pressure signal. Rotational speed of the test was 1500 rpm.
Conclusions
Results provide a quantitative comparison of the plastic gear's NVH level against the one of a steel gear pair of same geometry, operating at the same conditions. While the noise levels measured for the steel gear pairs were for 10 dB or more higher than the noise levels of tested plastic gear pairs, the main benefit can be seen in much lower vibrations generated by the plastic gear pairs. Vibrations generated by a gear pair are in majority of practical applications the main noise generator.
As the observed differences between the different plastic combinations were not on the same level as when compared to steel gear pairs, a difference in NVH performance could nevertheless be observed. The best performing material combination especially in terms of vibrations was the POM – PA66+30%GF, while the highest vibrations against the plastic gear pairs were measured for the POM – PA66 gear pairs. The meshing stiffness of the POM – PA66 gear pair was the lowest among the tested pairs, and while providing good damping it resulted also in the highest transmission error, which is the main source of vibrations in gear pairs. Gear pairs consisted of one unreinforced and one reinforced gear exhibited a higher meshing stiffness and consequently a lower transmission error, which resulted also in lower vibrations generated by the gear pair.
Future Outlook
There are several open topics on the plastic gears NVH, which still need to be addressed and systematically studied. It is well accepted by the professional public that the plastic gear NVH increases with the increasing wear on the gears. To the best of author's knowledge there have not been any relevant studies published yet, where the wear's effect on the NVH would be systematically studied and evaluated. A similar open topic is also the effect of the grease. It is generally accepted that introducing grease to the gearbox the noise and vibrations get reduced. It would however be valuable to have such effect more systematically quantified.